How Are We Getting Used To Climate Disasters? The Shifting Baseline Effect
Imagine watching a river’s water level rise rapidly. In the first year, it surges 5 meters above normal — shocking. In the second year, 6 meters. In the third, 7. Each time you think: “This is incredible, this is a disaster!” But by the fifth year, when it rises 9 meters, you already say: “Well, compared to the previous years, that’s normal.”
This is exactly how the climate shifting baseline effect works — one of the most insidious mechanisms that gradually changes our perception of what is “normal.”
Between August 13 and 19, 2025, our planet endured numerous extreme climate events that together reveal a disturbing trend: we are living in an era where anomalies are becoming the new normal.
In Pakistan, monsoon rains killed 358 people, destroying villages and leaving tens of thousands homeless.
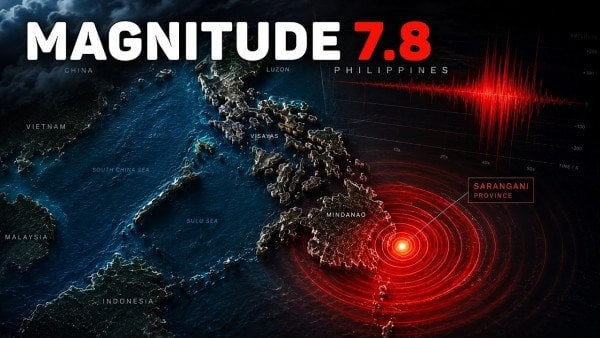
In Indonesia, a magnitude 5.8 earthquake destroyed 66 buildings, including a church during a service.
Hurricane Erin strengthened from a tropical storm to a Category 5 monster in just 25 hours — an unprecedented pace. Even more unusual, such a powerful hurricane appeared in August, whereas the peak season is normally in September.
But the most alarming thing is not the events themselves — it is how they are represented in the data.
Scientists call this the “shifting window effect”: statistical baseline periods are constantly updated to include the most extreme recent years.
For example:
As of August 19, 2025, wildfire damage in the EU reached 1,015,024 hectares. Compared with the 2006–2015 average (256,702 ha), that’s nearly 4 times higher. But if we use the updated 2006–2024 baseline (354,628 ha), the deviation drops to 2.9 times.
This approach creates the illusion of stability when, in reality, the system has already broken away from the old norms.
It’s like measuring a patient’s temperature, but shifting the thermometer scale every day so that yesterday’s fever becomes “normal.” By the end of the week, 40°C may look like “just slightly above average.” That is how statistical smoothing hides the true scale of climate disasters.
So when the media say, “Wildfires are only slightly worse than average,” it doesn’t mean the situation is under control. It means the “average” already includes catastrophic figures from recent years.
What is dangerous is not only the catastrophic escalation of natural disasters but also the way we perceive them — or rather, fail to perceive them.
📌 On our channel, watch more materials about the real causes of intensifying climate disasters and their progression based on mathematical models:
👉 "Catastrophic Earthquakes Are Inevitable. Scientists’ Warning": https://youtu.be/Af0gKjSmlwI
It’s Inevitable! A scientific report opened the world’s eyes to the truth about climate:
👉 "New Climate Report. Scientists Urgently Call for Humanity's Assistance": https://youtu.be/PAFdsPFwz8Q
👉 Share this video with those who still think that “the weather just got weird.” Every view is a step toward more people seeing reality. Knowledge saves lives — don’t let the truth remain behind the scenes.
Time code:
00:00 — Introduction: the hidden reality of climate disasters
00:40 — Floods in India and Pakistan: destroyed villages and hundreds of victims
03:07 — Earthquake in Indonesia (M5.8): destruction and panic
04:16 — Hurricane Erin: from tropical storm to Category 5 monster
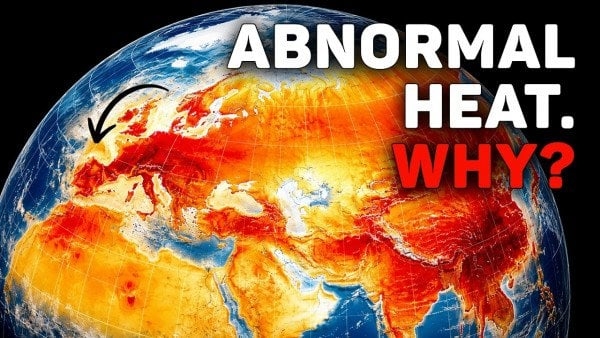
05:48 — Russia: record-breaking temperatures in the Arctic and Siberia
07:01 — Mexico: ice storm and a paralyzed city
08:23 — Australia: the strongest earthquake in 50 years
09:15 — Typhoon Podul: landfall on Taiwan and China
11:12 — Spain and Portugal: the largest wildfires in decades
13:28 — Why “average figures” hide the true scale of disasters


Leave a comment